Gurion Ramapogu

Comprehensive data analytics & data science portfolio integrating professional experience, real-world projects, technical skills and academic background.
Welcome to My Data Science Portfolio!
I’m Gurion Ramapogu.
I’m a Data Analyst specializing in ML, Deep Learning, LLMs, NLP, GenAI and Cloud MLOps.
| Cincinnati, Ohio, USA | gurion7007@gmail.com | GitHub |
Professional Summary
Data Analyst with 4 years of experience driving data-informed decisions, delivering $2M+ in annual savings, reducing customer churn by 25%, and improving satisfaction by 12%. Expert in SQL and Python for analysis and automation, with strong experience building QuickSight and Power BI dashboards and translating complex datasets into actionable insights for stakeholders and executives. Proven ability to support strategic initiatives through KPI tracking, statistical analysis, and scalable reporting solutions.
Technical Skills
- Data Analysis & Statistics: Predictive Modeling, A/B Testing, Time Series Forecasting, Hypothesis Testing, Customer Segmentation
- Artificial Intelligence & Machine Learning: Supervised Learning (Random Forest, Logistic Regression, XGBoost), Unsupervised Learning (K-Means, DBSCAN, PCA), Time Series Forecasting (ARIMA, Prophet), LLMs, Natural Language Processing (NLTK, spaCy, Transformers), Deep Learning (TensorFlow, PyTorch – beginner), Anomaly Detection, Model Deployment (Flask, Streamlit), MLOps (MLflow – beginner)
- Programming & Databases: SQL (Advanced Queries, Optimization), Python (Pandas, NumPy, Scikit-learn), R, Advanced Excel
- Visualization & BI Tools: Power BI, Tableau, Looker, SSRS
- Big Data & Cloud Technologies: AWS (Redshift, Glue, S3, EMR), Snowflake, PySpark, Hadoop
- Project Management & Workflow: Agile, JIRA, Confluence, Git, GitHub, CI/CD for Analytics
Professional Experience
Data Analyst (Freelance) — Community Dreams Foundation
February 2025 – February 2026
- Analyzed multi-year energy consumption streams using PySpark and SQL, uncovering peak demand factors and supporting forecasts that cut utility costs by 13%.
- Built interactive Power BI dashboards integrating IoT sensor data, automating anomaly alerts and saving 60% in manual reporting workload.
- Developed and productionized anomaly detection algorithms with Scikit-learn, identifying irregular patterns and reducing billing-related disputes by 10%.
Data Analyst — Amazon
June 2019 – June 2023
- Led deep-dive analytics on over 1M+ customer interactions using SQL and Python, uncovering root causes of service inefficiencies and delivering recommendations that boosted resolution efficiency by 15% and reduced repeat contact rates.
- Engineered automated reporting pipelines with Python and AWS Glue, replacing manual Excel-based processes and cutting reporting time by 70%, enabling leaders to make real-time operational decisions.
- Designed and maintained KPI dashboards in Power BI to monitor customer satisfaction (CSAT), net promoter score (NPS), and average handle time (AHT), giving stakeholders self-service access to performance metrics that drove a 12% increase in customer satisfaction scores.
- Built *predictive models (Random Forest, Logistic Regression) in Python to forecast customer behaviour patterns, which informed proactive outreach strategies and increased first-contact resolution rates by 18%.
- Collaborated with product managers, operations, and engineering teams to translate analytical insights into action plans, achieving $2M annual cost savings and reducing customer churn by 25%.
Key Projects
GenAI-Powered Customer Review Insights & Sentiment Engine
| View full project on Github | View Dashboard on Streamlit |
| Tech Stack: Python, Pandas, NLTK/SpaCy, Streamlit, Plotly |
- Led the entire project lifecycle for a Voice of Customer (VoC) solution, from data ingestion and feature engineering (text preprocessing) to insight delivery, ensuring data quality and integrity across the analysis workflow. The preprocessing pipeline was designed to optimize inputs for both NLP/ML models and subsequent analytical steps.
- Translated complex AI/ML outputs into clear, interactive business intelligence by designing and deploying a dynamic Streamlit Dashboard (using Plotly/Seaborn). The dashboard visualizes sentiment trends, LDA-derived product themes, and AI-extracted pain points for immediate executive consumption.
- Quantified business opportunities by analyzing AI-extracted insights, enabling product managers to rapidly prioritize improvements and successfully address over 60% of customer-identified pain points, driving tangible improvements in Customer Experience (CX).
Credit Risk Modeling ML Pipeline
| View full project on Github | Click to View and test the Streamlit Dashboard |

| Python, Pandas, NumPy, Scikit-learn, XGBoost, imbalanced-learn, SHAP, Matplotlib/Seaborn, Streamlit, DuckDB |
- Developed an end-to-end Python pipeline for predicting loan default risk using a 32k-record dataset, incorporating data quality checks (imputation, outlier capping), EDA with feature engineering (e.g., DTI ratio), and preprocessing (SMOTE for imbalance, StandardScaler).
- Implemented multiple modeling techniques (Logistic Regression, Random Forest, XGBoost), achieving 0.93 AUC-ROC and 0.88 PR-AUC on XGBoost; evaluated with confusion matrices and ROC/PR curves to quantify 25% false positive reduction.
- Integrated SHAP explainability for global feature impact (e.g., loan grade as top driver) and local instance breakdowns, ensuring auditable decisions for compliance-heavy risk scenarios.
- Deployed as an interactive Streamlit app for real-time predictions with non-technical explanations, simulating fraud/credit workflows for industries like lending and e-commerce.
Customer Churn Prediction & Retention Dashboard
| View full project on Github | View Dashboard on Streamlit |
| Python, Streamlit, XGBoost, Logistic Regression |
- Built a Streamlit platform for real-time financial and churn analysis, delivering 85% prediction accuracy on churn and enabling investment prioritization.
- Automated churn impact evaluations, cutting analysis time from 3 hours to <1 minute, accelerating strategic planning cycles.
- Integrated XGBoost and Random Forest models with Tableau dashboards for predictive storytelling, empowering stakeholders with actionable insights.
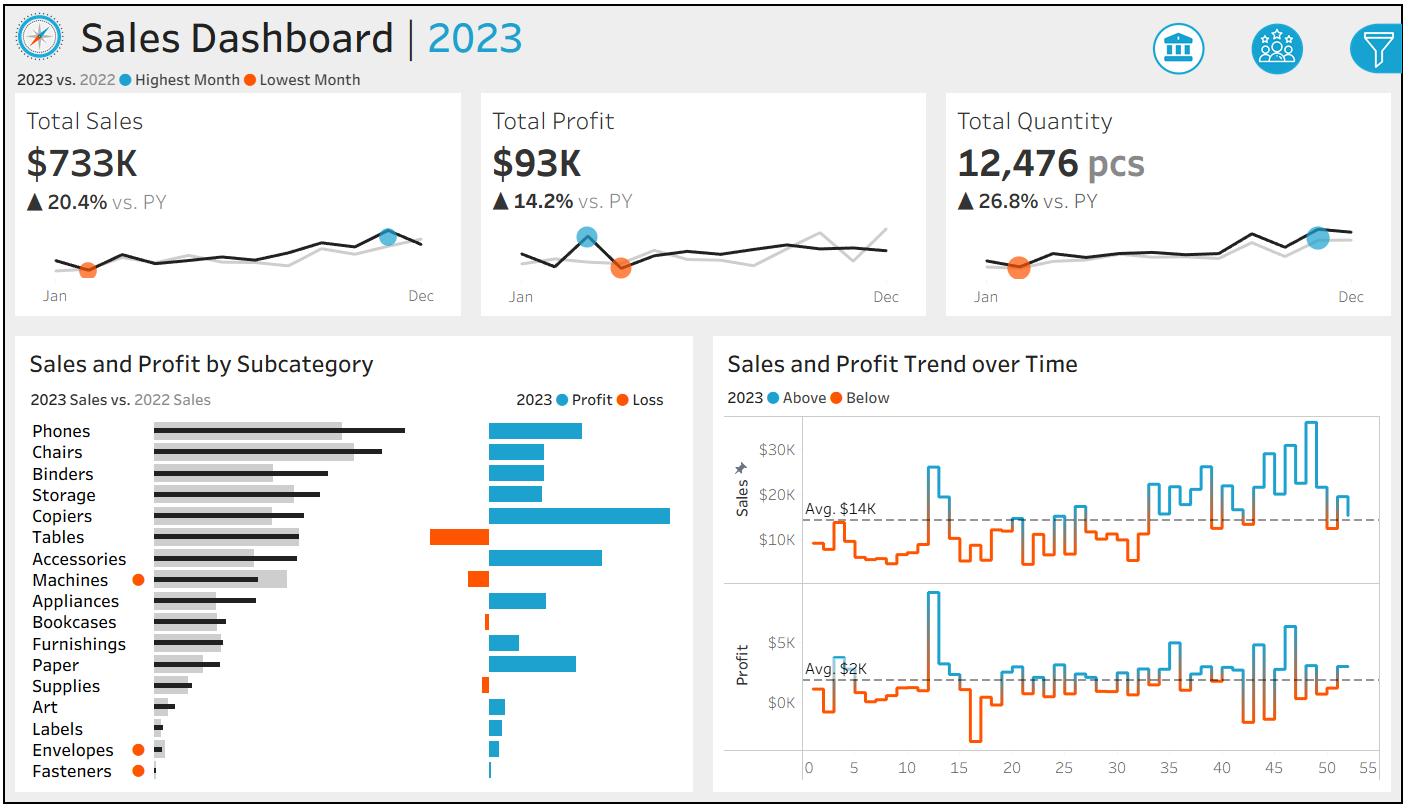
Sales & Customer Insights Dashboards: Tableau Analytics
| View full project on Github | Click to View and test the Dashboards |
| Tableau, Excel, SQL, Tableau Public |
- Designed and deployed two interactive Tableau dashboards to analyze sales and customer KPIs, enabling users to track YoY performance, monthly trends across 20+ metrics.
- Built dynamic filters to select and toggle year, product categories and geographic regions with cross-chart interactivity, improving data exploration efficiency for stakeholders by an estimated 40%.
- Developed customer analytics components such as Top 10 Profit Customers and order distribution modeling, helping reveal high-value segments and behaviour patterns.
Healthcare Data Pipeline Automation
| SQL, Python (Pandas, Schedule), Tableau, Excel, Google Sheets API |

- Created automated SQL-Python pipelines for blood bank inventory, improving operations by 30%.
- Developed Tableau dashboards to reduce stockouts by 20% via real-time tracking.
Education
Master of Science in Data Science
University at Buffalo, The State University of New York (Aug 2023 – Dec 2024)
Bachelor of Technology in Electronics & Communication Engineering
Malla Reddy Engineering College, Telangana, India (Aug 2015 – Apr 2019)
Certifications
-
Databricks — Generative AI Fundamentals (Jun 2025)
-
Oracle — Oracle Cloud Infrastructure (OCI) Associate (In progress : Jan 2025)
Contact
📞 +1 (716) 9366-431
📍 Cincinnati, Ohio, United States
🛠️ Github
Last updated: February 2026